

The Portfolios I Copy
The portfolios I copy are based on the expensive and in-depth research that lots of banks and investment houses do. They use their research to choose what they’re going to invest in. Why not let them do all that work and then, for once, turn the tables and use it for free?
This page explains how I’ve gone about doing that and what that translates to (in plain English) for when I want to invest.
I explain what I mean by “mixed bonds”, “global bonds”, “global shares” etc. on Asset Classes Explained.
On this page:
They all disagree over the best investment mix
I’ve calculated an average of what they think
Using their expensive research for free
Less than £1,000 to invest
Between £1,000 and £5,000 to invest (Tier 1)
Between £5,000 and £15,000 to invest (Tier 2)
Between £15,000 and £50,000 to invest (Tier 3)
Between £50,000 and £500,000 to invest (Tier 4)
More than £500,000 to invest (Tier 5)
They all disagree over the best investment mix
If I were to copy the portfolio of a bank or investment company, I would have to choose which bank or investment company to copy and which of their investment portfolios to copy. There are thousands.
If I limit it only to portfolios that are “risk-rated” (i.e., they have low-risk, medium-risk, and high-risk rated portfolios), there’s still hundreds of them.
What’s more, they all have a slightly different opinion about what’s going to happen in the future, when it’s going to happen and how it’s going to affect different investments.
They can’t all be right because they’re all different. However, with the millions they spend each year on research and analysis (thanks to the very high fees that they charge their clients), they’re probably not too far wrong.
I’ve calculated an average of what they think
Therefore, why not average out the investment choices that they make as a group and copy that?
That’s exactly what I’ve done and what I will continue to update from time to time. It takes a huge amount of work to do this, so the updates will probably be a few times a year, ideally once every three months.
The section below, “using their expensive research for free” gives an outline on how I’ve done this (as with everything on this site, there’s more detail with cartoons and humour in the book). The remaining sections on this page apply the average allocations according to the amount of money I have available to me to invest.
The most complex allocation (Tier 5) has the most money available to invest and, therefore, the most asset classes (click here to find out what is meant by asset classes). As the amount of money available to invest gets smaller, the costs incurred from buying funds becomes more significant, so I reduce the number of asset classes. This will make more sense as you read on.
Using their expensive research for free
That’s what I’ve done.
I have painstakingly gathered data from over 80 risk-rated funds run by banks and investment companies that managed trillions (not millions, not billions, trillions) of pounds-worth of investments.
I’ve calculated the average allocation for each of:
- Lower-risk investment portfolios – drawn from 26 lower-risk rated funds
- Medium-risk investment portfolios – drawn from 20 medium-risk rated funds
- Higher-risk investment portfolios – drawn from 35 higher-risk rated funds
 Rip-off Tip-off – Understanding Risk
I’ve explained risk in the section Taking the Right Amount of Risk.
That section includes a risk questionnaire which helps to determine what level of risk might be right for you.
By using these portfolios that I’ve created, I’m able to benefit from the expensive research that the banks and investment houses have conducted…for free! That said, it took sodding ages for me to research and put together.
Less than £1,000 to invest
If I had less than £1,000 to invest, I’d set up a stocks and shares ISA and put money into that on a regular basis.
Once I’d reached at least £500, I’d buy one fund: if I were a low-risk investor, I would choose a low-cost passive fund tracking mixed bonds. If I were a medium- or higher-risk investor, it would be a low-cost passive fund tracking global shares.
Tier 1: Between £1,000 and £5,000 to invest
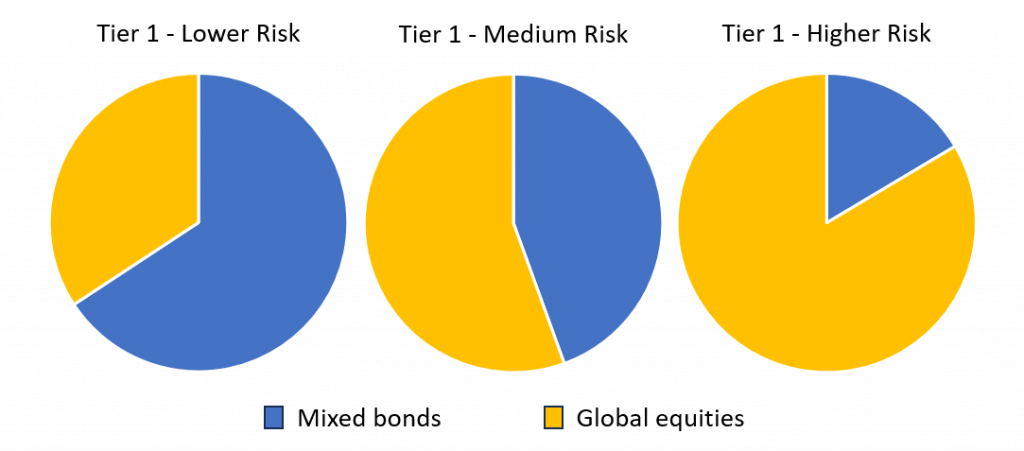
| Cash* | Mixed Bonds | Global Shares | |
| Lower-risk | 4% (at least £100) | 64% | 32% |
| Medium-risk | 4% (at least £100) | 43% | 53% |
| Higher-risk | 4% (at least £100) | 18% | 78% |
Next, I go to Specific Funds I Include in My Portfolios to identify precisely which funds I need to buy to get those allocations in my investment portfolio.
Tier 2: Between £5,000 and £15,000 to invest
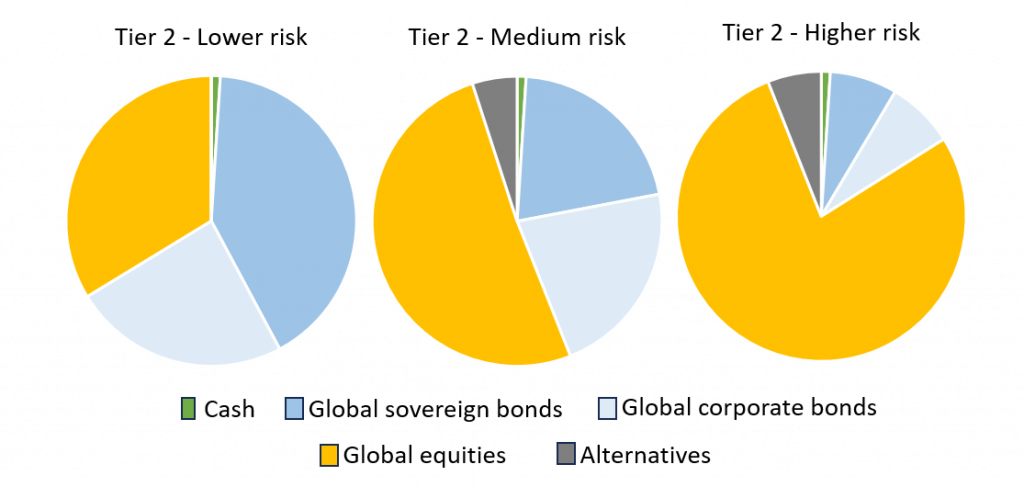
| Cash* | Global Government Bonds | Global Corporate Bonds | Global Shares | Alternatives | |
| Lower-risk | 2% (at least £100) | 40% | 25% | 33% | 0% |
| Medium-risk | 2% (at least £100) | 21% | 22% | 50% | 5% |
| Higher-risk | 2% (at least £100) | 7% | 8% | 78% | 5% |
Next, I go to Specific Funds I Include in My Portfolios to identify precisely which funds I need to buy to get those allocations in my investment portfolio.
Tier 3: Between £15,000 and £50,000 to invest
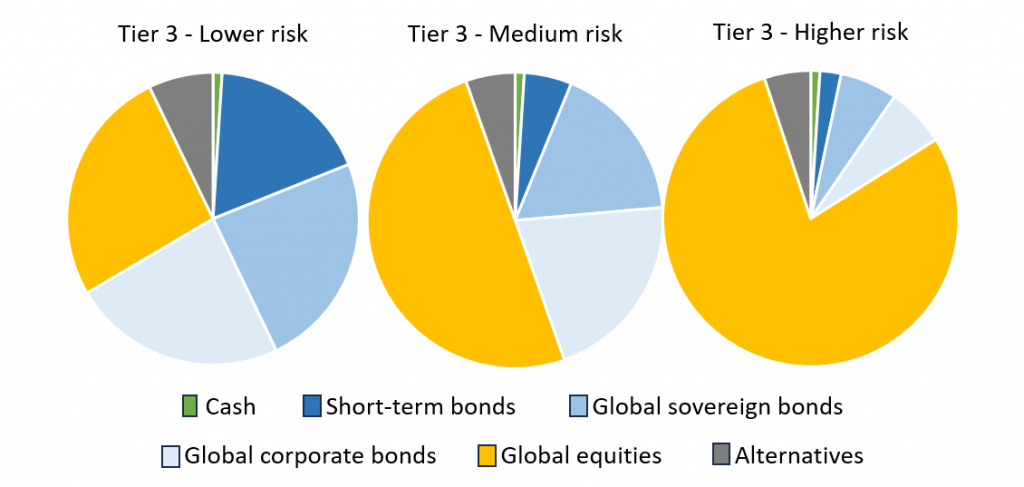
| Cash* | Short-term Bonds | Global Government Bonds | Global Corporate Bonds | Global Shares | Alt | |
| Lower-Risk | 1% | 18% | 24% | 24% | 26% | 7% |
| Medium-Risk | 1% | 5% | 17% | 22% | 50% | 5% |
| Higher-Risk | 1% | 2% | 6% | 6% | 80% | 5% |
Next, I go to Specific Funds I Include in My Portfolios to identify precisely which funds I need to buy to get those allocations in my investment portfolio.
Tier 4: Between £50,000 and £500,000 to invest
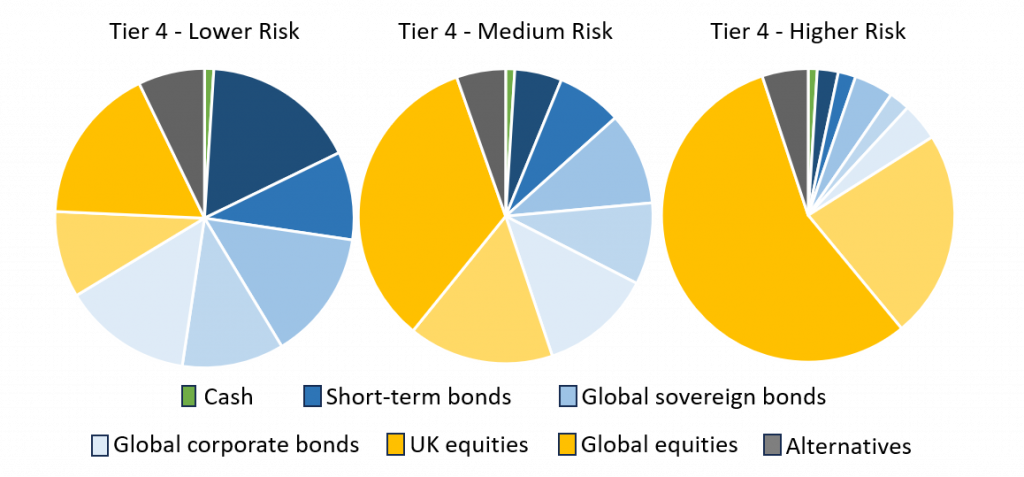
| Cash | Short-term Bonds | UK Sov Bonds | Glob Sov Bonds | UK Corp Bonds | Global Corp Bonds | UK Shares | Glob Shares | Alt | |
| Lower risk | 1% | 17% | 10% | 14% | 11% | 14% | 9% | 17% | 7% |
| Medium risk | 1% | 5% | 7% | 10% | 9% | 12% | 17% | 34% | 5% |
| Higher risk | 1% | 2% | 2% | 4% | 2% | 4% | 23% | 57% | 5% |
Next, I go to Specific Funds I Include in My Portfolios to identify precisely which funds I need to buy to get those allocations in my investment portfolio.
Tier 5: more than £500,000 to invest
This is the actual, detailed allocation that I derived from averaging out loads of allocations from banks and investment companies. It’s the one that all the preceding tiers are based on. The numbers go to a decimal point because it is the most precise.
Personally, I don’t see the point of manually applying the minutiae of 41 different allocations when the categories by Tier 5 allocations take care of it to much the same effect.
But, in the unlikely event that you have a substantial sum to invest AND you want to get involved with the allocations (which can be fun if you’re into it), then by all means these allocations might be a point at which to start your thinking.
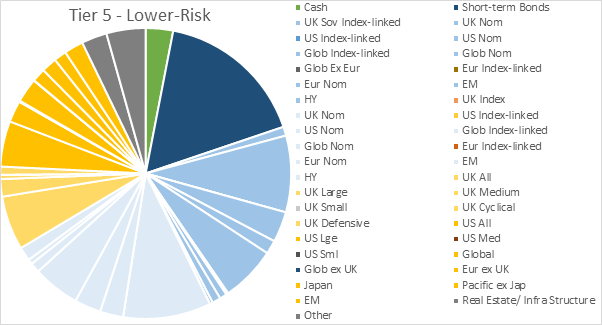
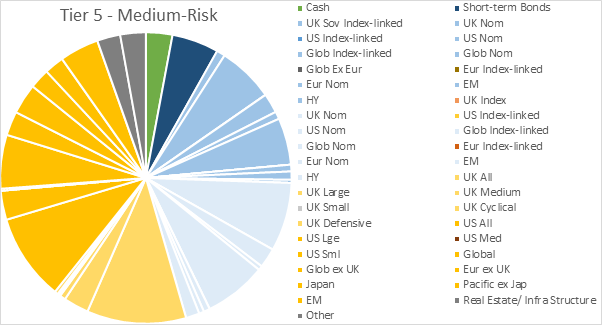
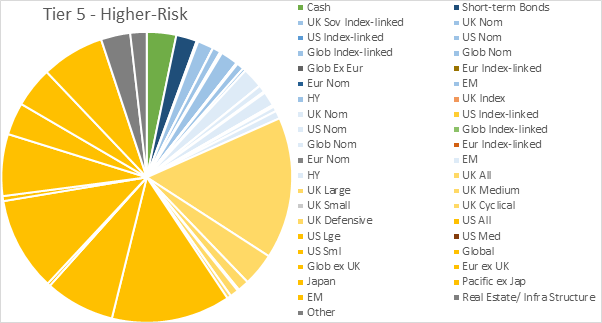
Cash and short-term bonds
| Cash | Short-term Bonds | |
| Low | 3.04% | 16.76% |
| Med | 2.94% | 5.20% |
| High | 3.27% | 2.32% |
Government bonds
| UK Sov Index-linked | UK Nom | US Nom | Glob Index-linked | Glob Nom | Glob Ex Eur | Eur Nom | EM | HY | |
| Low | 0.99% | 8.51% | 3.40% | 1.52% | 6.17% | 0.24% | 0.79% | 0.95% | 0.33% |
| Med | 0.95% | 6.25% | 2.17% | 0.83% | 5.20% | 0.00% | 0.74% | 0.93% | 0.34% |
| High | 0.18% | 1.76% | 0.90% | 0.23% | 1.94% | 0.00% | 0.14% | 0.80% | 0.33% |
Corporate bonds
| UK Nom | US Nom | Glob Index-linked | Glob Nom | Eur Nom | EM | HY | |
| Low | 9.78% | 2.57% | 2.95% | 5.23% | 1.09% | 0.54% | 1.55% |
| Med | 7.63% | 2.19% | 0.48% | 6.94% | 0.69% | 0.56% | 1.51% |
| High | 2.29% | 0.79% | 0.16% | 1.61% | 0.20% | 0.54% | 0.88% |
UK Shares
| All | Large | Medium | Small | Cyclical | Defensive | |
| Low | 6.01% | 1.94% | 0.47% | 0.00% | 0.00% | 0.90% |
| Med | 11.02% | 2.80% | 0.64% | 0.19% | 0.15% | 0.37% |
| High | 15.79% | 3.68% | 1.26% | 0.17% | 0.95% | 0.45% |
Other shares
| US All | US Lge | US Sml | Global | Glob ex UK | Eur ex UK | Jap | Pacific ex Jap | EM | |
| Low | 5.06% | 2.39% | 0.13% | 2.69% | 0.03% | 1.51% | 1.70% | 1.40% | 2.14% |
| Med | 9.64% | 3.23% | 0.23% | 5.97% | 2.67% | 3.38% | 2.22% | 2.18% | 4.36% |
| High | 13.22% | 7.75% | 0.33% | 10.43% | 0.56% | 6.88% | 3.60% | 4.49% | 7.00% |
Alternatives to stocks and bonds
| Real Estate/ Infra Structure | Other | |
| Low | 2.83% | 4.35% |
| Med | 2.58% | 2.83% |
| High | 3.26% | 1.82% |
Next, I go to Specific Funds I Include in My Portfolios to identify precisely which funds I need to buy to get those allocations in my investment portfolio.