

Performance and Costs
On this page, I provide updates on the performance and costs of the example portfolios I’ve set up using my own money.
Click on the green links to jump to the relevant portfolio.
£10,000 Higher-Risk Rated Portfolio
£50,000 Higher-Risk Rated Portfolio
£10,000 Medium-Risk Rated Portfolio
£50,000 Medium-Risk Rated Portfolio
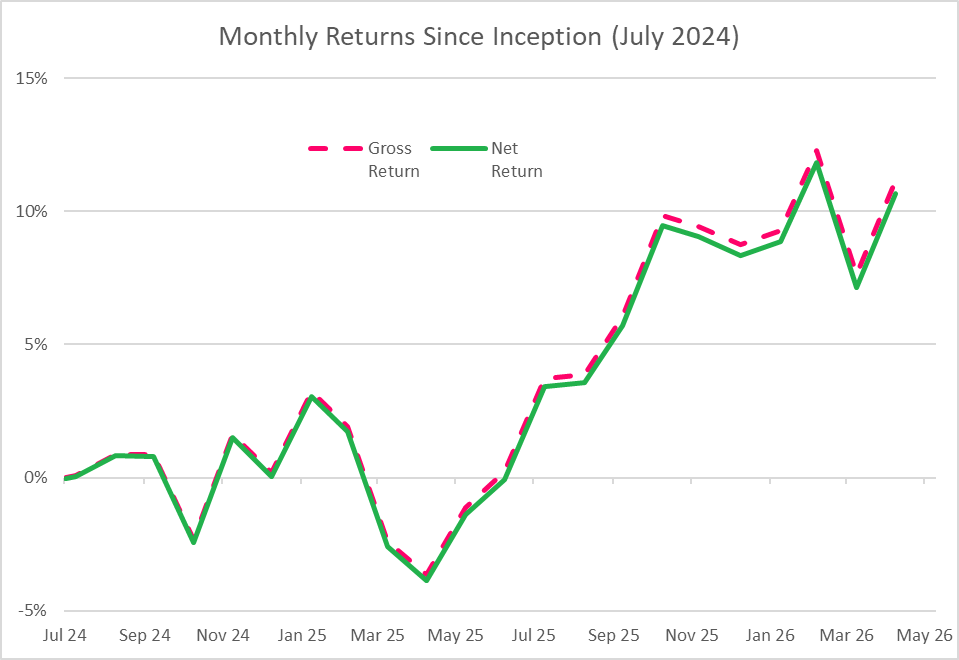
£10,000 Higher-Risk Rated Portfolio
Data sourced from Refinitiv Eikon and David Ryder.
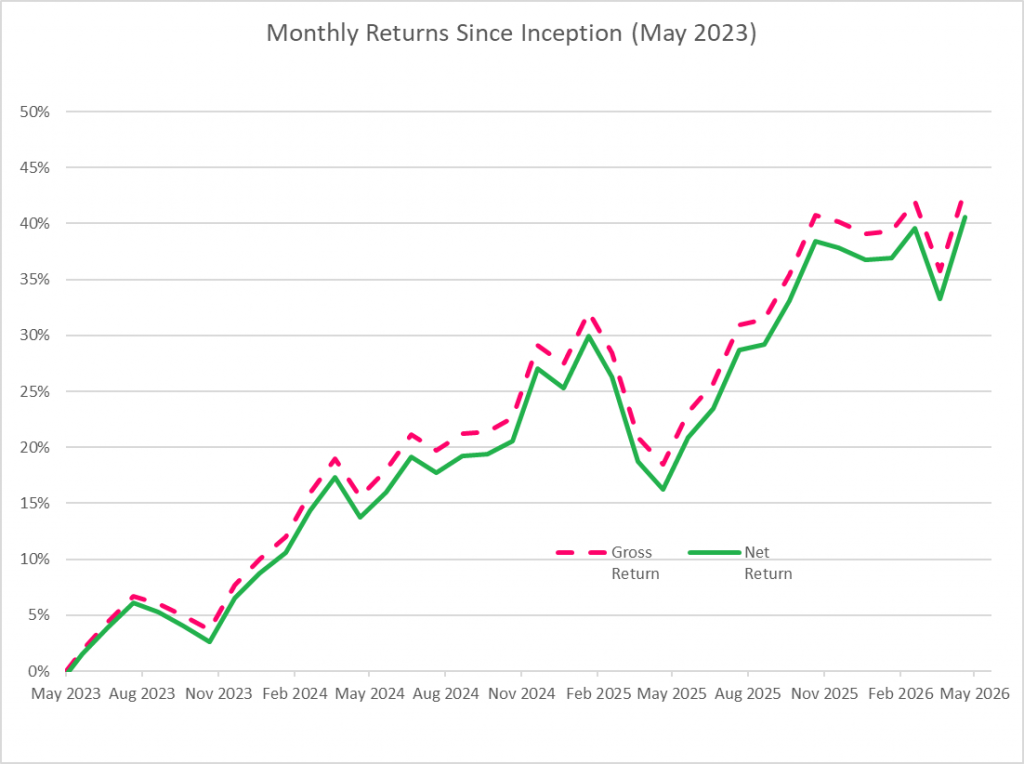
Let’s be honest here, a 40% net return (i.e., after all fees and charges) in just three years is phenomenal. Am I pleased? Hell, yeah. Do I expect it to continue? Hell, no. Does that mean I should move my money out and put it into something else? Absolutely NOT.
This fund has followed the overall prices of shares and, to a lesser extent (it being a higher-risk portfolio) bonds. It now faces an economic landscape of rising inflation due to tariffs, conflicts and rising oil prices. The growth that this portfolio, and that of any other than generally follows what’s going on in the markets, will reflect the slowdown. And that’s exactly what I expect.
The one thing I must do, is rebalance and I’m just about to do that because it’s due now. I’ll share another video on the process of rebalancing and the effect it has on 1. fees (it costs to trade), and 2. allocations.
Data sourced from Refinitiv Eikon and David Ryder.
Return to the top of this page
£50,000 Higher-Risk Rated Portfolio
Data sourced from Refinitiv Eikon and David Ryder.
Return to the top of this page
£10,000 Medium-Risk Rated Portfolio
Data sourced from Refinitiv Eikon and David Ryder.
Return to the top of this page
£50,000 Medium-Risk Rated Portfolio
Data sourced from Refinitiv Eikon and David Ryder.
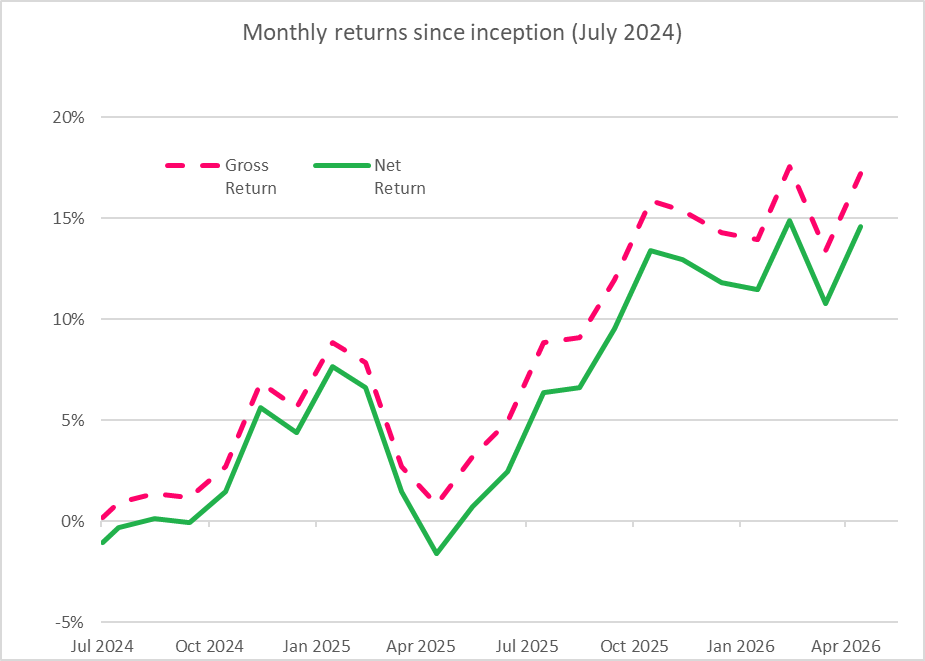
This £50k medium-risk portfolio provides a good contrast to the performance of the higher-risk £10k portfolio at the top of this page.
Between February and May 2025, the higher-risk £10k portfolio lost almost 15 percentage points in value and then added 20 percentage points in value. Over the same period the medium-risk £50k portfolio lost only 8 percentage points and then added 13.
In other words, the higher risk portfolio moves up and down further or more quickly than the portfolio that has medium risk.
This is not an entirely scientific comparison, but it gives a useful indication of what is meant by “risk”, i.e., the speed and severity of price movements.